You have data and insights to share. But it’s difficult to do so in a way that tells the whole story accurately and convincingly. Visual representation is usually the best option, but it is highly time-consuming, and often requires design expertise. (“This is taking forever. I bet that by the time I can share this data, it will be completely out of date.)
Finding a way to captivate your audience by turning boring data into stunning visuals can be a challenging process, but all that effort could go towards other aspects of your business.
You need a way to easily create and share insightful data visualizations with just a few clicks.
Say hello to Columns AI
Columns is an AI-powered tool that makes it easy to turn your data into beautiful visual stories and generate insights that are easy to share with your readers, customers, and other stakeholders.
Captivate your audience with AI-driven visual data storytelling
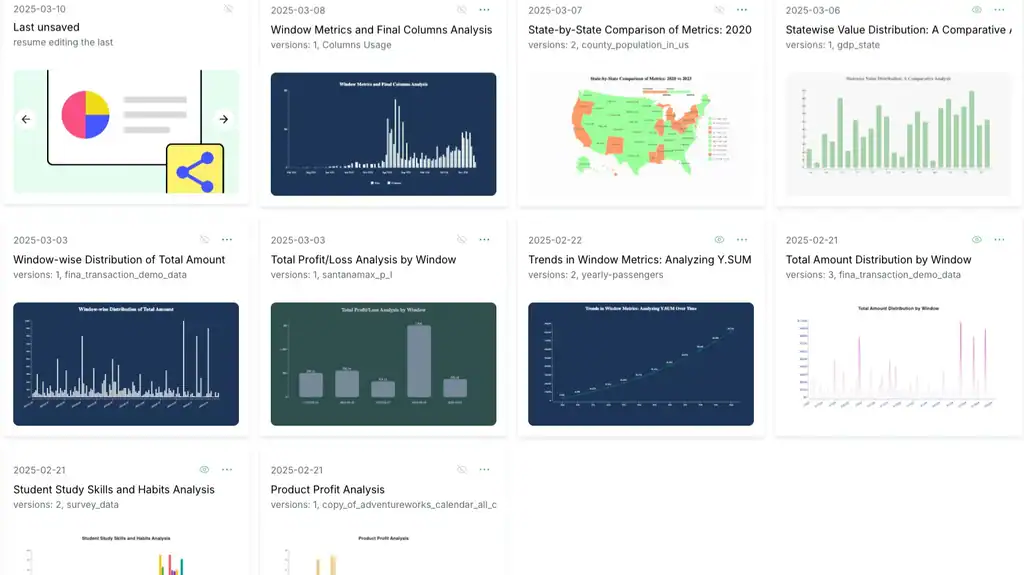
It makes it a breeze to turn your data into beautiful interactive storytelling graphics that are easy to analyze and understand.
Connect any of the available integrations (Notion databases, Google Sheets, Snowflake, Databricks, a REST API…) or upload your data directly via CSV file with all the important data for you and your business that you want to analyze and present in comprehensive charts.

Thanks to the numerous templates and the automatic initial insights and visualizations that Columns propose right after scanning your data, creating and switching between data visualizations is just a few clicks away.